Introduction
Fiddler is one the most popular tool to inspect your Http Traffic. This tool helps you to test REST API / SOAP Web requests very easily. If you are using SSIS PowerPack or REST API ODBC Drivers you will find this post really useful to debug various REST API integration issues.
When you run Fiddler on your system, it acts as a tiny Web Proxy that sits between your client application and the webserver. Fiddler only starts capturing traffic when you running it. By default, it runs on the local machine (127.0.0.1) Port 8888. You can change the default port from Tools > Options.
How to download Fiddler (it’s FREE)
You can download Fiddler Classic using this link for FREE (If that link doesn’t work then try this one)
Make sure that you have Downloaded the Fiddler Classic and not a Fiddler Everywhere. Both products might have same features listed in this article but screenshots and steps listed in this article is about Fiddler Classic.
It is not our product, this article is just to show you how you can analyze the API Request and Response call made from our Tasks/Components/Drivers.
How to start/stop Fiddler two ways – Capture HTTP(s) Traffic
After you install Fiddler, Go to Start Menu >Search for Fiddler
Launch Fiddler exe and it will start capturing HTTP traffic (For HTTPS URL see next section).
Run fiddler to start capturing web requests/responses made by various client applications on your system (e.g. Curl, Chrome, Internet Explorer). To start/stop capture go to File > Check/Uncheck [Capture Traffic] option.
By default when you run Fiddler it behaves like the default proxy server on your system. However, not all web requests appear in fiddler unless the client application using a system Default Proxy.
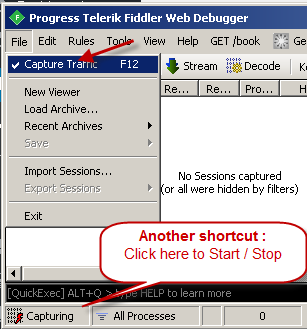
Start / Stop Fiddler Capture
How to capture HTTPS traffic in Fiddler
By default Fiddler doesn’t show the content of Web requests made to HTTPS Url (Secure site) because it’s encrypted. Perform the following steps if you want to see HTTPS Traffic.
- Launch Fiddler
- Go to Tools > Telerik Fiddler Options > HTTPS > Check [Decrypt Https Traffic Option]
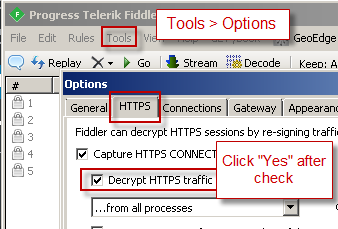
Fiddler Option – Decrypt HTTPS Traffic
- Once prompted Accept certificate generated by Fiddler
How to filter traffic for specific Domain or URL (contains)
If you see lots of unwanted log entries after you enable Capturing then try following setting to Include / Clude certain log entries from the Capture making it easier to analyze.
- Go to Filters Tab
- Check Show only if URL contains. Type any words you like to check in URL. e.g. zappysys.com will include only those URL which has “zappysys.com” anywhere in the Full URL. You can add multiple included by adding space after words
- If you like to exclude some URLs then check Hide if URL contains option and enter string like previous step

How to view Web Request and Response in Fiddler
Once your web requests appear on the left side panel. Simply double click on the request entry to view. On your right side, you will see two panels.
- Top Panel – Request View
- Bottom Panel – Response View
Here is an example of seeing API calls generated by aws command line requests/response in Fiddler.
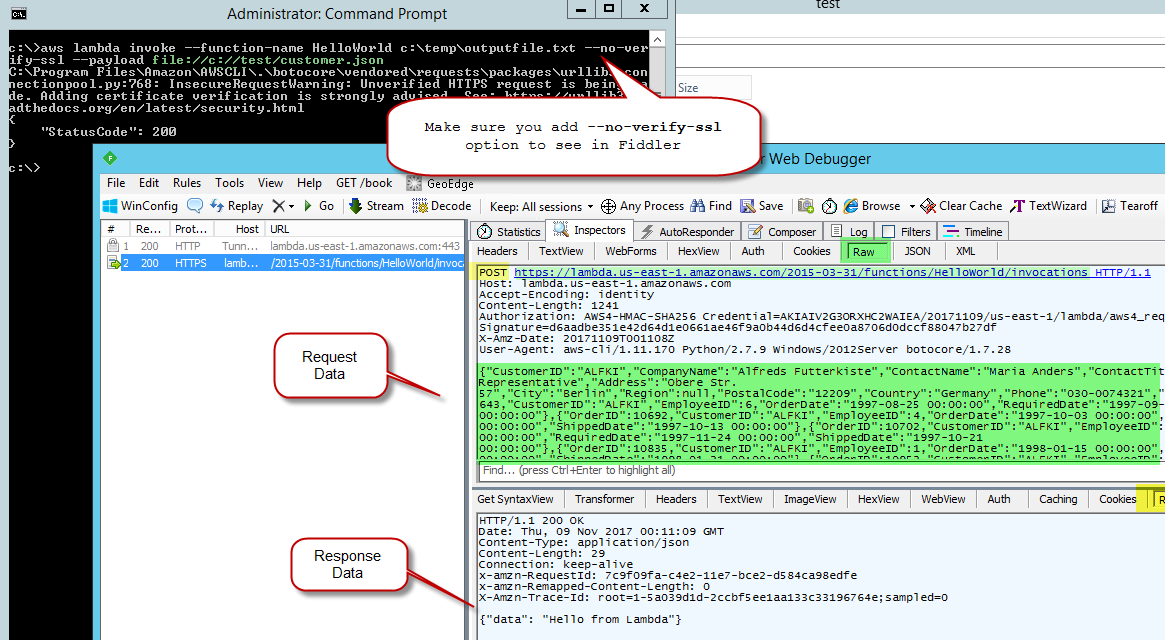
Capture AWS Command line (CLI) request using Fiddler
How to Test API using Fiddler (Call REST API for without Postman)
Fiddler comes with another cool feature just like Postman so you can test your API call. Basically, there will be a time when you like to edit your request and test with different data (e.g. URL / Body or Headers). If that’s the case you can directly go to Composer Tab or Replay existing request right Right Click.
How to replay existing request / edit / send new request
To reply to the existing request
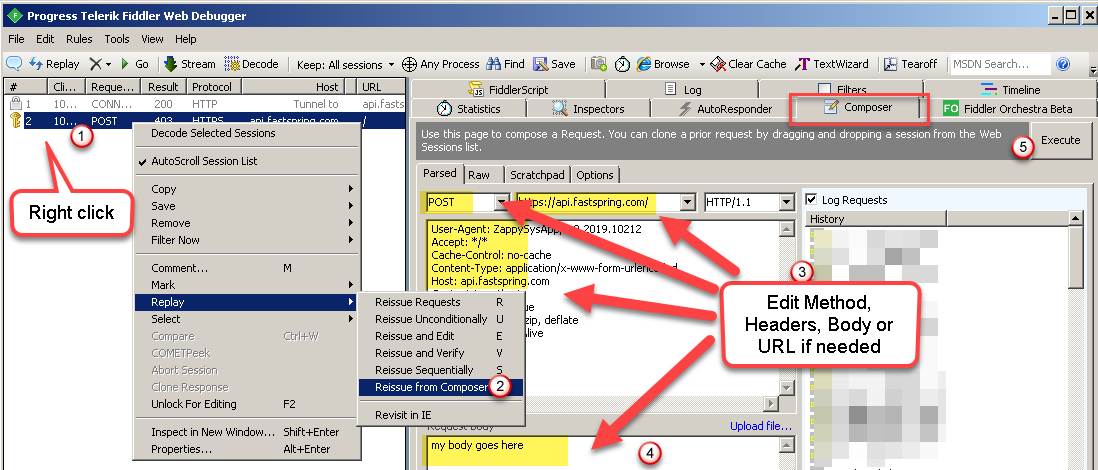
Test Web Requests in Fiddler Composer – Replay existing REST API requests or send new one (Edit Header, Body, URL)
How to view and format JSON / XML data in Fiddler
By default Fiddler will show you JSON / XML Tab if request body or response data in that format (see JSON / XML tabs on top and bottom panels). But what if you like to see in Raw Text but in Syntax Highlighted / formatted way?
Format Fiddler Request / Response (XML or JSON). View text with Syntax Highlighting
How to use fiddler Converters (e.g. Base64 / URL encode – decode)
There will be a time when you like to encode / decode strings appearing in web requests. Fiddler has another very handy feature call Send to Text Wizard. This option appears in most right click Menu in Raw / Syntax View / Headers view and other places.
Encode / Decode / Convert Text in Fiddler (e.g. Base64, URL Encode)
How to add Request Start Time, Overall Elapsed Time Columns in Fiddler
It’s really useful to see how much time each request is taking. For that, you can try the below steps in Fiddler Classic
- Right-click on any Header Column
- Select “Customize Columns”
- Choose “Session Timers“
- Choose Overall_Elaspsed and ClientConnectedTime from the dropdown
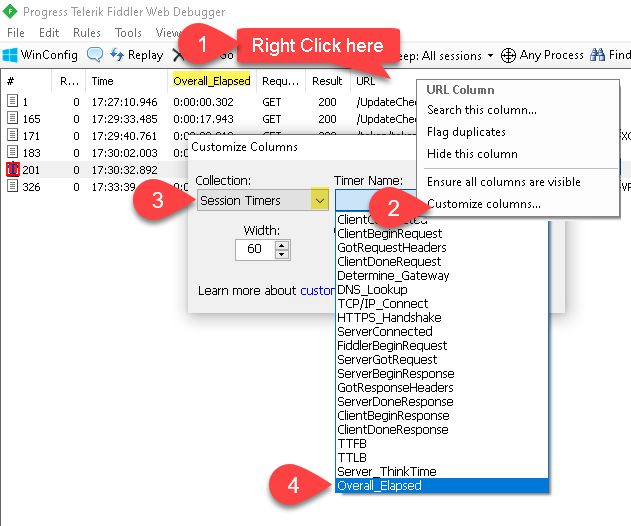
How to see request start time, overall elapsed time in Fiddler
How to edit and execute the processed requests in Fiddler
If you want to re-execute existing requests in Fiddler with different parameters then try the below steps
- Select request from the left-hand side panel (or may be bottom side)
- Press “E” and you will see a panel like below
- Edit your request (i.e. URL, Header or Body)
- Click on Run to Complete
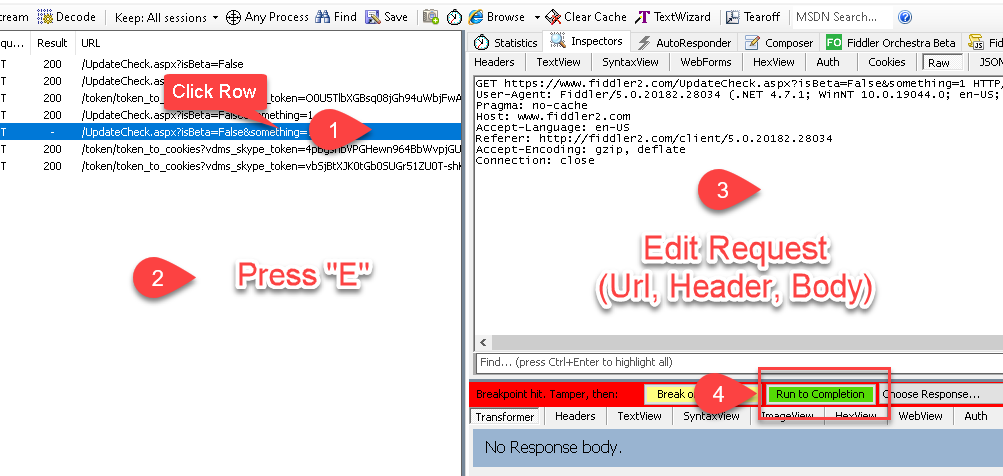
Edit, Execute Processed Requests in Fiddler
How to enable AutoResponder – Fake Response (Rule based)
If you want to test some API calls for testing purposes, then you can use the AutoResponder feature of Fiddler. It allows you to match URL pattern and send response text from a local file. Here is how to enable Fake Response (Rule-based Auto Response)
- Select URL from the log (Optional) – If you skip this step then in step#3 you will have to enter URL manually.
- Go to AutoResponder Tab
- Click Add Rule (if you didn’t select Log entry then Rule editor will have blank URL)
- Enter / Change URL Rule in the Rule editor if needed. By default it uses EXACT match rule. Click here to learn more about more rules
- Enter a file path where you have saved Fake Response you like to serve if URL rule.
Examples:
Exact URL match: EXACT:HTTP://abc.com/api/v3/projects/123/milestones
Pattern URL match: method:GET regex:(.*)/api/v3/projects/([\w\d-])+/milestones(.*)

Fiddler AutoResponder (Test Fake Response from local file – Rule match based on URL Pattern)
How to diff Fiddler requests
Sometimes you like to see difference between two requests. Fiddler comes with very handy feature. Just select two requests and click Diff Option in Right click menu. For diff to work make sure you install some diff utilities like KDiff3 or WinMerge.
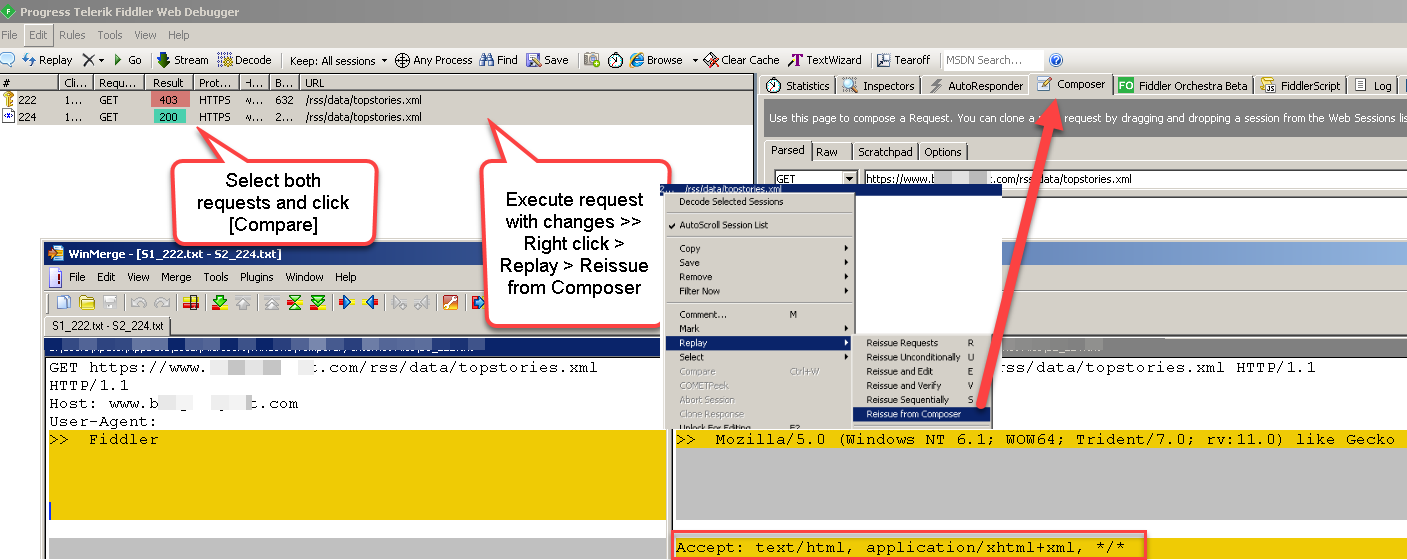
Compare requests in Fiddler / Reissue same request with changes (Composer Tab)
How to show SSIS PowerPack requests in Fiddler
In most cases SSIS PowerPack requests will apperar in Fiddler without any extra configurations. However in some cases applications like SSIS PowerPack cannot detect it as System Default Proxy automatically. In that case try to enable Proxy settings in HTTP Connection or OAuth Connection. If you are not using connection manager then some Components like JSON Source offers its own Proxy tab so just check Enable Proxy.
By default Fiddler register itself as Default Web Proxy on port 8888 (i.e. http://127.0.0.1:8888 )
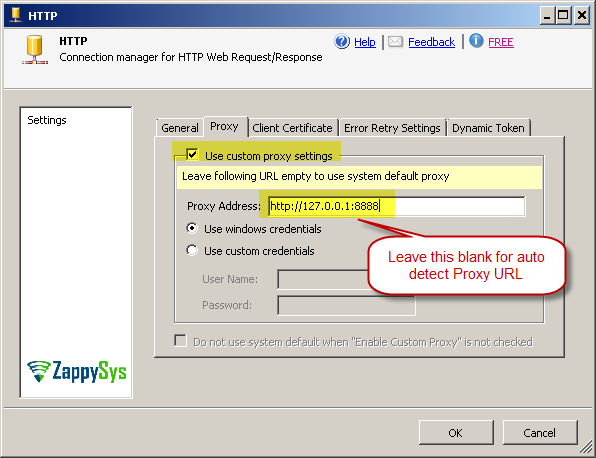
Using Proxy Settings in SSIS PowerPack
View HTTP Request in Fiddler
To inspect HTTP Web Request using Fiddler perform following steps.
- Click on the web request entry on left pane
- Click on the Inspector Tab > Click Raw from top panel
View HTTP Response in Fiddler
To inspect HTTP Web Response using Fiddler perform following steps.
- Click on the web request entry on left pane
- Click on the Inspector Tab > Click Raw from bottom panel
- You can also click on JSON or XML Tab if your want to see response coming in specific format
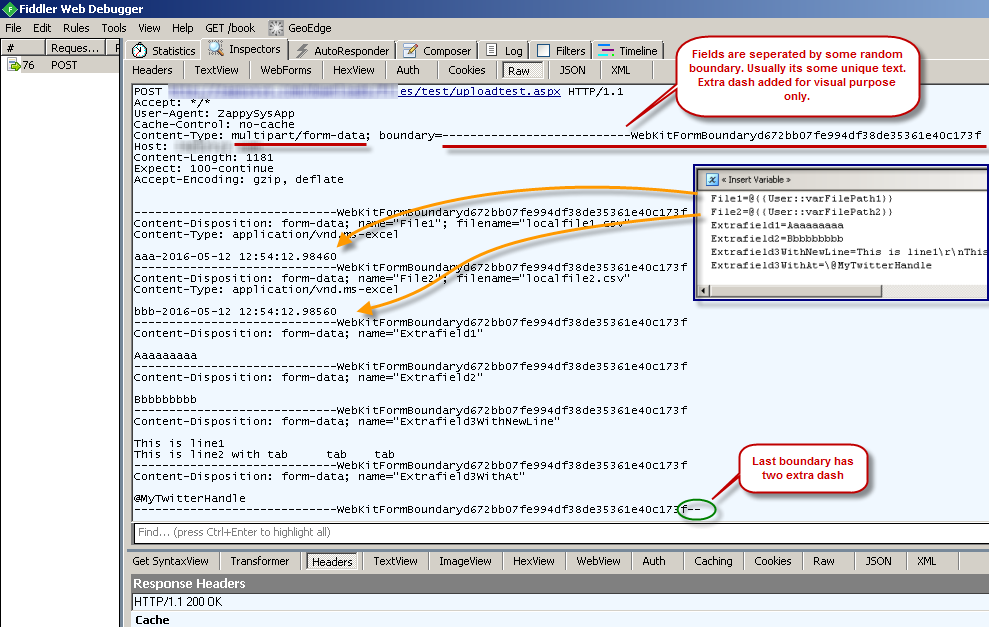
HTTTP Multipart POST – File Upload Example – Check Fiddler Request
View compressed (i.e. gzip, deflate) Response in Fiddler raw view
When response is compressed then by default you wont be able to see it in Raw tab. When response is compressed you may see header like below in response headers. You can also click on
|
1 |
Content-Encoding: gzip |
To view compressed response in fiddler perform following steps.
- Click on the web request entry on left pane
- Click on the Inspector Tab > Click Transformer tab from bottom panel
- Click on transformer tab and select No compression option and then click Raw tab
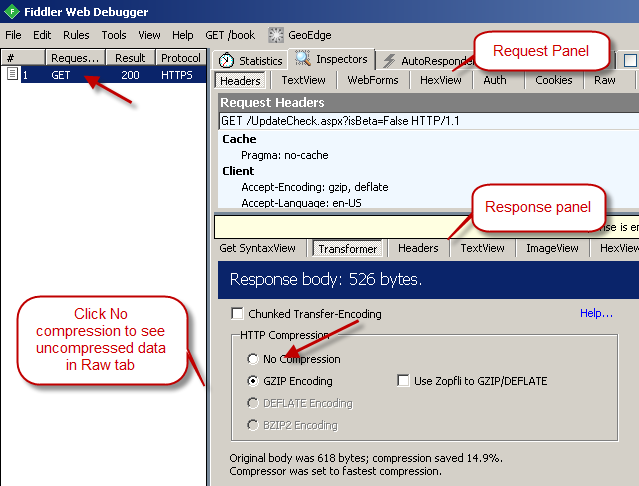
View uncompressed data in Fiddler (GZip, Deflate Encoding)
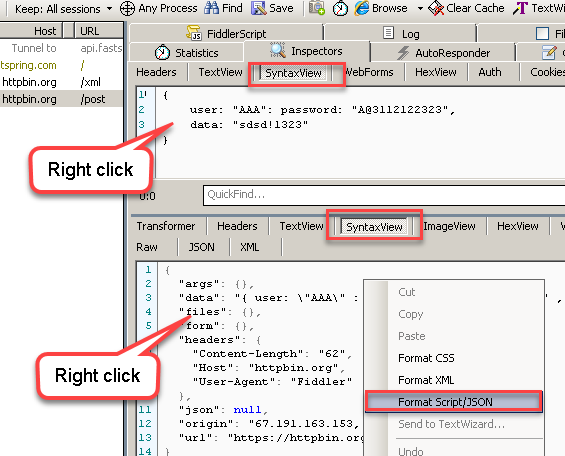
How to view Formatted JSON / XML
If you have JSON or XML response and you like to view formatted documents then you can go to Syntax View in the Response Panel and right-click and format
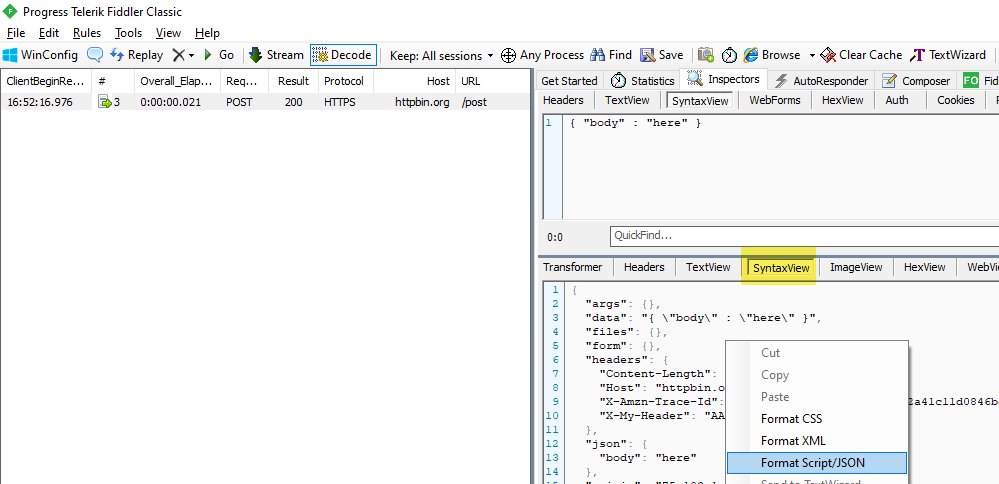
How to format Fiddler Request / Response (JSON/XML document)
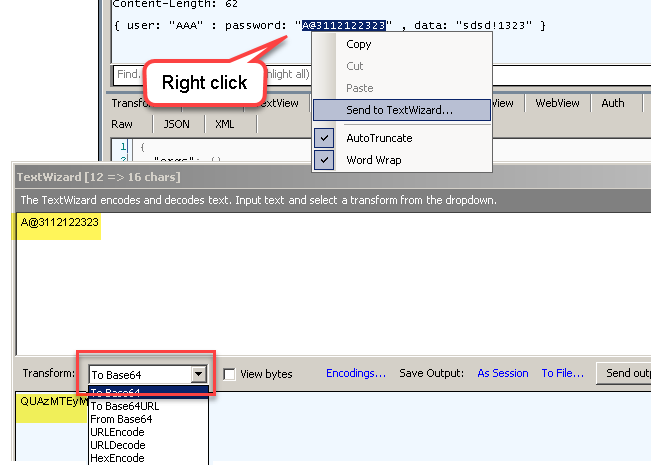
Using Fiddler Text Wizard Tools (Encode / Decode – Hex, HTML, URL, Base64)
If you would like to perform some conversions like the one below, then you can use the TextWizard tool found in Fiddler. It’s very handy. Simply right click and click on Send to TextWizard option (found in most tabs / screens)
- Base64 Encode / Decode
- HTML Encode / Decode
- URL Encode / Decode
- Hex Encode / Decode
- and more…
Launching Fiddler TextWizard from Right click menu
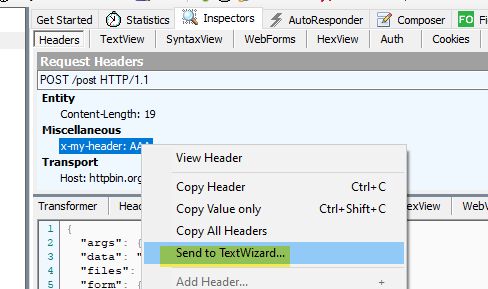
Fiddler Send To TextWizard Menu
Launching Fiddler TextWizard from Toolbar
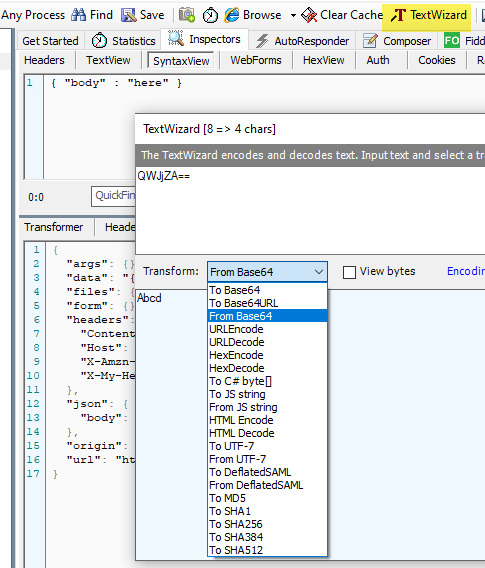
Fiddler TextWizard UI
How to compare requests / re-execute
Sometimes you want to compare two requests and find the difference. Here is how you can compare requests and re-execute same request or edit it.
Compare requests in Fiddler / Reissue same request with changes (Composer Tab)
How to show web request of Curl in Fiddler
By default some application such as Curl doesn’t use system default Proxy. That means if you running Fiddler and trying to analyze requests made from Curl command line then it wont show up. Its easy to tell curl that which proxy server to use. Just use -x command line option with proxy server IP and Port (e.g. Default Fiddler IP and port … 127.0.0.1:8888 )
|
1 |
curl.exe -v -x 127.0.0.1:8888 https://google.com |
How to show SoapUI requests in Fiddler
If you are using an application like SoapUI then also it may not use Fiddler as default web proxy. to show your SoapUI web requests in Fiddler try following options
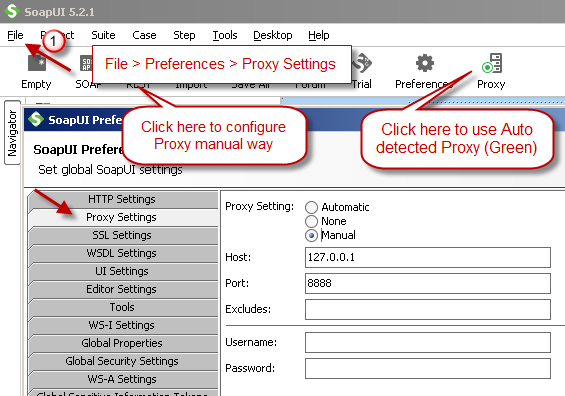
Configure Proxy Settings in SoapUI
How to show aws command line requests in Fiddler
If you are using aws command line application and want to show requests in Fiddler then add –no-verify-ssl like below. This way you can capture RAW API requests and use it like this in SSIS.
|
1 |
aws lambda invoke --function-name HelloWorld c:\temp\outputfile.txt --no-verify-ssl --payload file://c://test/customer.json |
How to show Windows Service requests in Fiddler (Local System Account)
By default if Fiddler launched as Admin it will capture most of requests by various apps. But if your like to capture Web requests which are issued by windows service such as ZappySys Data Gateway then you might have to do little extra work (Assuming Service is not setup Run As Your account). By default many service Run under “Local System” account
Here is how to capture those requests which are issued by service account.
- Go to Folder where Service Exe is located (If you are unsure simply right click on Service > Properties and check path)
- Create new file in the same folder where Service Exe is located. File name must be <yourexename>.exe.config
- Enter following XML text in your config file and save
1234567<configuration><system.net><defaultProxy enabled="true"><proxy proxyaddress="http://127.0.0.1:8888" bypassonlocal="False"/></defaultProxy></system.net></configuration> - Restart Service and check Fiddler now see requests are captured
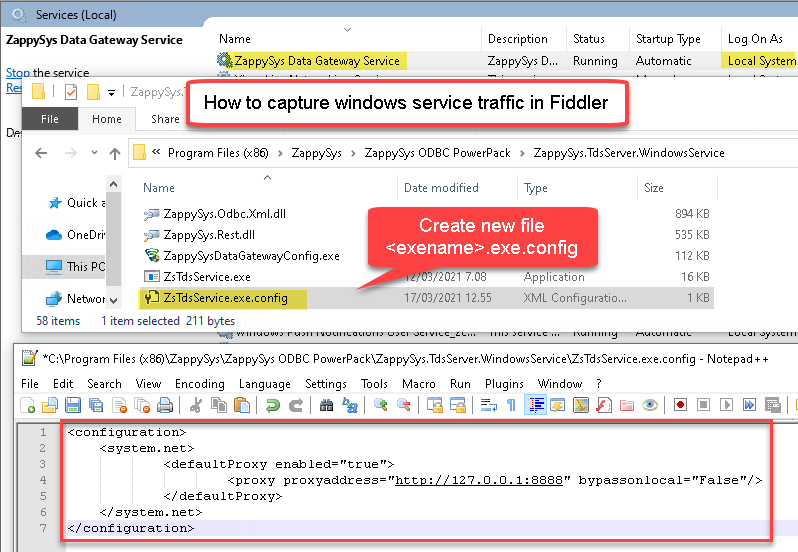
Capture Windows Service Web Requests in Fiddler (App Config method)
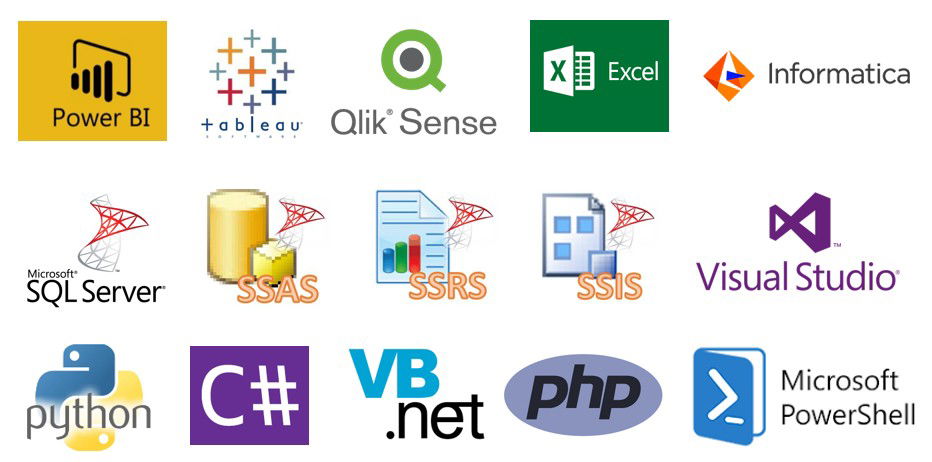
REST API integration using ODBC in BI Apps (e.g. Power BI, Excel, Informatica, Access, C#…)
If you want to consume API data in SQL Server (without ETL) or Live API consumption in Tools like Power BI, Excel, Tableau, SSRS, Talend, Informatica then use ODBC PowerPack from here. See below table for each use case.
|
BI / Reporting Tools Integration |
ETL Tools Integration | Programming Languages Integration |
|
|
|
Remove Fiddler Root Certificate (Uninstall / Untrust)
The Fiddler certificate is unique per machine / user, so you do not have to worry about someone else reusing it to intercept traffic, but still, for some reason, if you would like to uninstall the Fiddler root certificate (installed when you checked the Decrypt option), then perform the following steps.
- Goto Tools > Options > HTTPS
- Uncheck the Decrypt option first if it’s checked
- Click on Actions > Remove interception Certificates
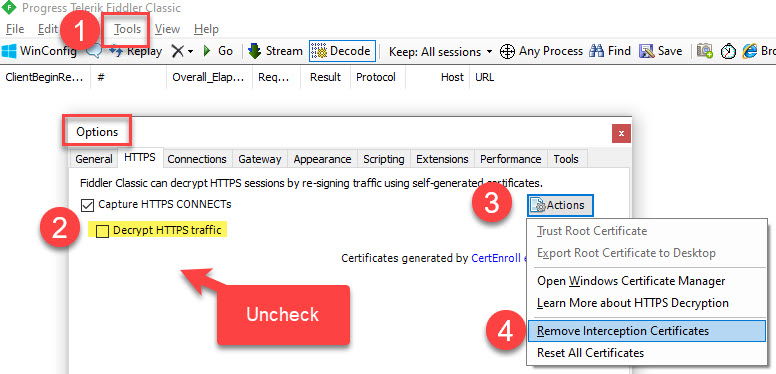
How to remove Fiddler Root Certificate
Coding-Free REST API integration using ODBC Drivers (For many Reporting / ETL Tools)
If you ever need to read /write data from REST API without writing a single line of code, check these ODBC Drivers / API Connectors.
ODBC PowerPack is a collection of high-performance drag and drop ODBC / API Drivers for various Modern / Legacy data sources. Connect data in Reporting / ETL Tools / Programming Languages.
Coding-Free REST API integration in SSIS (Microsoft ETL Tool)
If you use SSIS as your primary etl tool and you have API integration usecase then check this product.