| Property Name |
Description |
| LoggingMode |
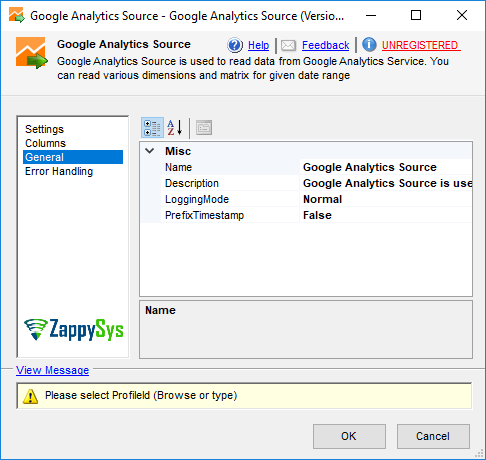
LoggingMode determines how much information is logged during Package Execution. Set Logging mode to Debugging for maximum log.
Available Options (Use numeric value listed in bracket if you have to define expression on this property (for dynamic behavior).
| Option |
Description |
| Normal [0] |
Normal |
| Medium [1] |
Medium |
| Detailed [2] |
Detailed |
| Debugging [3] |
Debugging |
|
| PrefixTimestamp |
When you enable this property it will prefix timestamp before Log messages. |
| QueryMode |
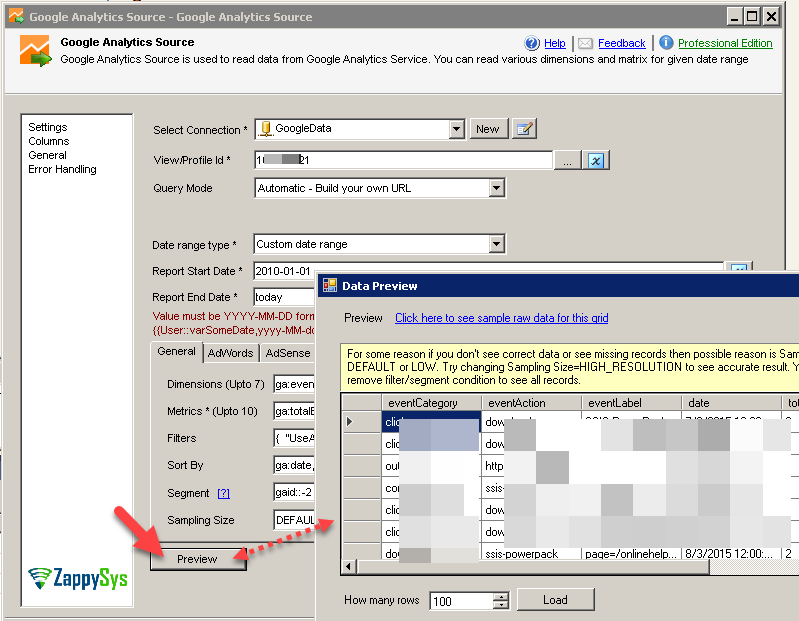
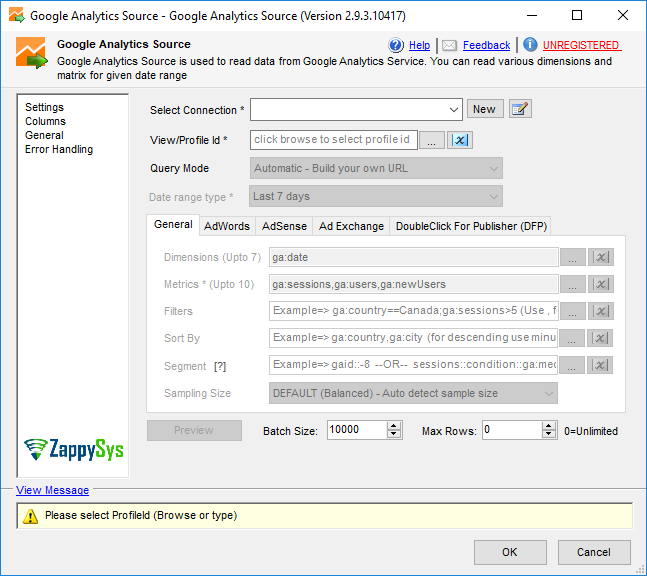
Query mode for google data. In Automatic mode you can specify various properties and it will create url for you.
Available Options (Use numeric value listed in bracket if you have to define expression on this property (for dynamic behavior).
| Option |
Description |
| Automatic [0] |
Automatic - Build your own URL |
| DirectUrl [1] |
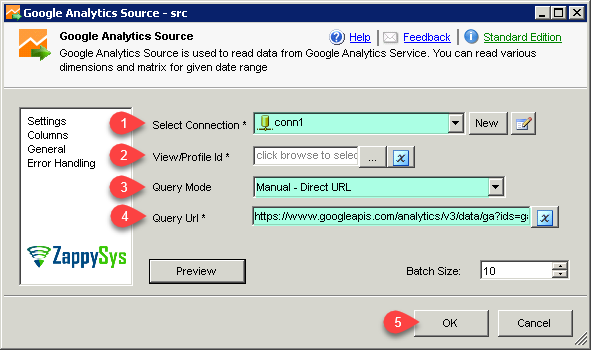
Manual - Direct URL |
| FromTemplate [2] |
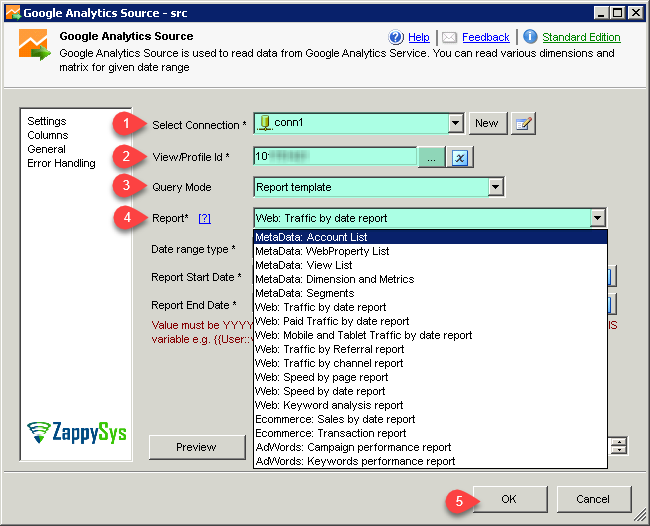
Report template |
|
| QueryUrl |
Direct URL for query. This is only applicable when QueryMode=DirectUrl. User pass all parameters in query string using full URL |
| QueryBody |
Request Body with parameters for GA4. This is only applicable when QueryMode=DirectUrl. User pass all parameters in query string using full URL |
| QueryTemplate |
Predefined settings for query. This is great way to start with predefined templates so you don't have learn about various settings.
Available Options (Use numeric value listed in bracket if you have to define expression on this property (for dynamic behavior).
| Option |
Description |
| MetaAccounts [0] |
MetaData: Account List |
| MetaProfiles [1] |
MetaData: WebProperty List |
| MetaViews [2] |
MetaData: View List |
| MetaColumns [3] |
MetaData: Dimension and Metrics |
| MetaSegments [4] |
MetaData: Segments |
| WebTrafficReport [5] |
Web: Traffic by date report |
| WebPaidTrafficReport [6] |
Web: Paid Traffic by date report |
| WebMobileAndTabletTrafficReport [7] |
Web: Mobile and Tablet Traffic by date report |
| WebReferralTrafficReport [8] |
Web: Traffic by Referral report |
| WebChannelTrafficReport [9] |
Web: Traffic by channel report |
| WebSpeedByPageReport [10] |
Web: Speed by page report |
| WebSpeedByDateReport [11] |
Web: Speed by date report |
| WebKeywordAnalysisReport [12] |
Web: Keyword analysis report |
| EcommerceSalesReport [13] |
Ecommerce: Sales by date report |
| EcommerceTransactionsReport [14] |
Ecommerce: Transaction report |
| AdWordsCampaignPerformanceReport [15] |
AdWords: Campaign performance report |
| AdWordsKewordsPerformanceReport [16] |
AdWords: Keywords performance report |
|
| ProfileId |
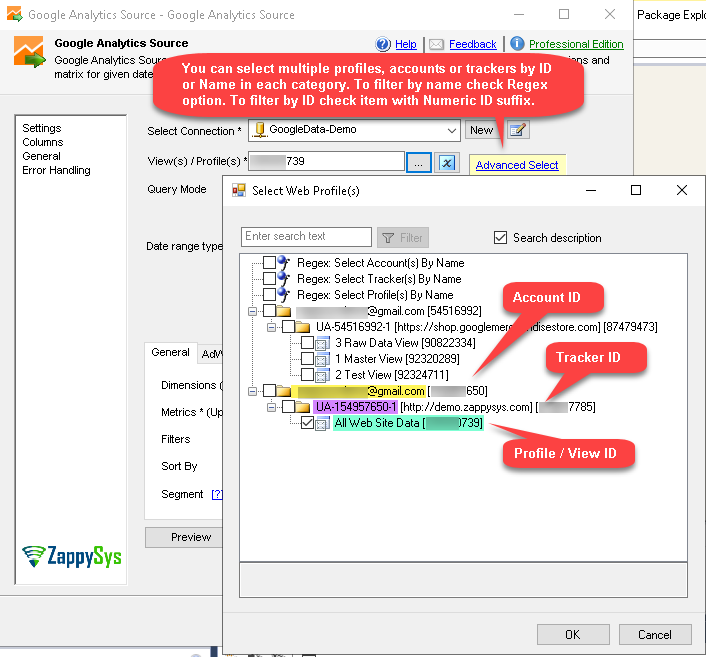
Web profile ID(s) or expression to select multiple profiles for which you want to retrieve data. This is the code of the website we have paired with the Reporting API. This property support filter by account, tracker and profile. You can use id or name in the advanced expression.
Syntax (Simple Select): {profile-id1}[,profile-id2]....[,profile-idN]
--OR--
Syntax (Advanced Select): [accounts={account-id1,[account-id1]...[account-idN]}|{regex:expression-for-account-name}][;trackers={tracker-id1,[tracker-id1]...[tracker-idN]}|{regex:expression-for-tracker-name}] [;profiles={profile-id1,[profile-id1]...[profile-idN]}|{regex:expression-for-profile-name}]
--------------Examples------------
Here are some examples of different ways you can supply list of profile names or ids
//1. Extract data from single profile (i.e. view). Use Single Profile ID.
100222333
//2. Extract data from multiple profiles (i.e. views). Use Profile ID list. In below example extract from View ID 100222333 and 100222444
100222333,100222444
--OR--
profiles=100222333,100222444
//3. Extract data from all accounts where profile name contains words like "blogs" or "help" or "test". You can filter based on name by using "regex:" prefix. If "regex:" prefix not specified then it will treat value as ID(s).
profiles=regex:(blogs|help|test)
//4. Extract data from all accounts where profile name DOES NOT contain words like "demo" or "test". You can filter based on name by using "regex:" prefix. If "regex:" prefix not specified then it will treat value as ID(s).
profiles=regex:^((?!demo|test).)*$
//5. Extract data from account names like "demo" --OR-- profile names like "help" or "test"
accounts=regex:demo;profiles=regex:(help|test)
//6. Extract data from all profiles of account IDs 10000001 and 10000002 and any profile names like "help" or "test"
accounts=10000001,10000002;profiles=regex:(help|test)
//7. Extract data for all profiles found under Tracker names like UA-100000-???? (i.e. UA-100000-1, UA-100000-2 ....)
trackers=regex:UA-1000000-\d+;
//8. Extract data for profile names like "test" or "demo" and profiles under Tracker names like UA-100000-???? (i.e. UA-100000-1, UA-100000-2 ....)
trackers=regex:UA-1000000-\d+;profiles=regex:(test|demo)
//9. Extract data for account name start with word "Zappy" or any profile name contains word like "test" or "demo"
accounts=regex:^Zappy;profiles=regex:(test|demo)
|
| DateRangeType |
Date range type for report. Use Custom date range if you have dynamic date range not listed in predefined list
Available Options (Use numeric value listed in bracket if you have to define expression on this property (for dynamic behavior).
| Option |
Description |
| Custom [0] |
Custom date range |
| MonthToDate [1] |
Current month to date |
| YearToDate [2] |
Current year to date |
| WeekToDate [3] |
Current week to date |
| Today [4] |
Today |
| Yesterday [5] |
Yesterday |
| LastWeek [6] |
Last week |
| LastMonth [7] |
Last month |
| LastYear [8] |
Last year |
| Last7Days [9] |
Last 7 days |
| Last10Days [10] |
Last 10 days |
| Last15Days [11] |
Last 15 days |
| Last30Days [12] |
Last 30 days |
|
| ReportStartDate |
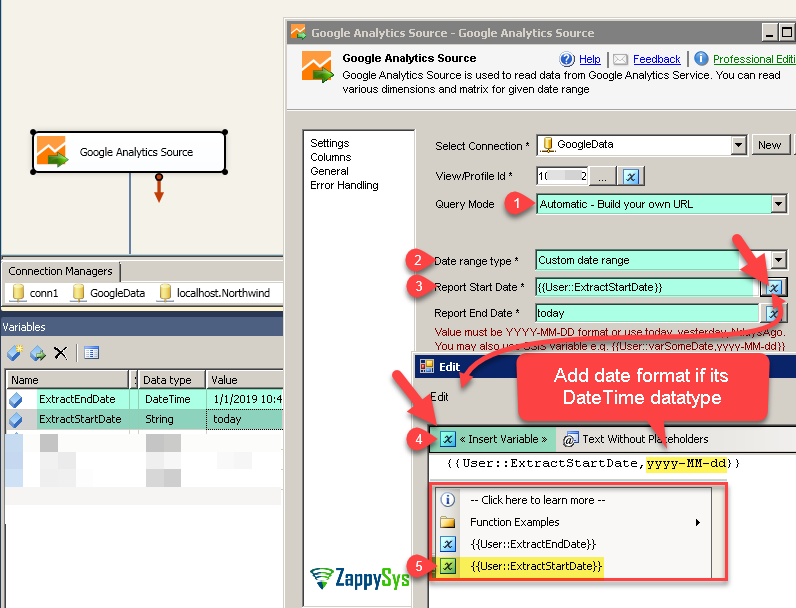
Start date for report date range. All Analytics data requests must specify a date range. If you do not include start-date and end-date parameters in the request, the server returns an error. Date values can be for a specific date by using the pattern YYYY-MM-DD or relative by using today, yesterday, or the NdaysAgo pattern. Values must match [0-9]{4}-[0-9]{2}-[0-9]{2}|today|yesterday|[0-9]+(daysAgo). The earliest valid start-date is 2005-01-01. There is no upper limit restriction for a start-date.Relative dates are always relative to the current date at the time of the query and are based on the timezone of the view (profile) specified in the query. Example date range for the last 10 days (starting today) using relative dates: ReportStartDate=9daysAgo and ReportEndDate=today. You may also use variable placeholders e.g. {{User::varStartDateString}} |
| ReportEndDate |
End date for report date range. All Analytics data requests must specify a date range. If you do not include start-date and end-date parameters in the request, the server returns an error. Date values can be for a specific date by using the pattern YYYY-MM-DD or relative by using today, yesterday, or the NdaysAgo pattern. Values must match [0-9]{4}-[0-9]{2}-[0-9]{2}|today|yesterday|[0-9]+(daysAgo). The earliest valid end-date is 2005-01-01. There is no upper limit restriction for an end-date. Relative dates are always relative to the current date at the time of the query and are based on the timezone of the view (profile) specified in the query. Example date range for the last 10 days (starting today) using relative dates: ReportStartDate=9daysAgo and ReportEndDate=today. You may also use variable placeholders e.g. {{User::varEndDateString}} |
| Dimensions |
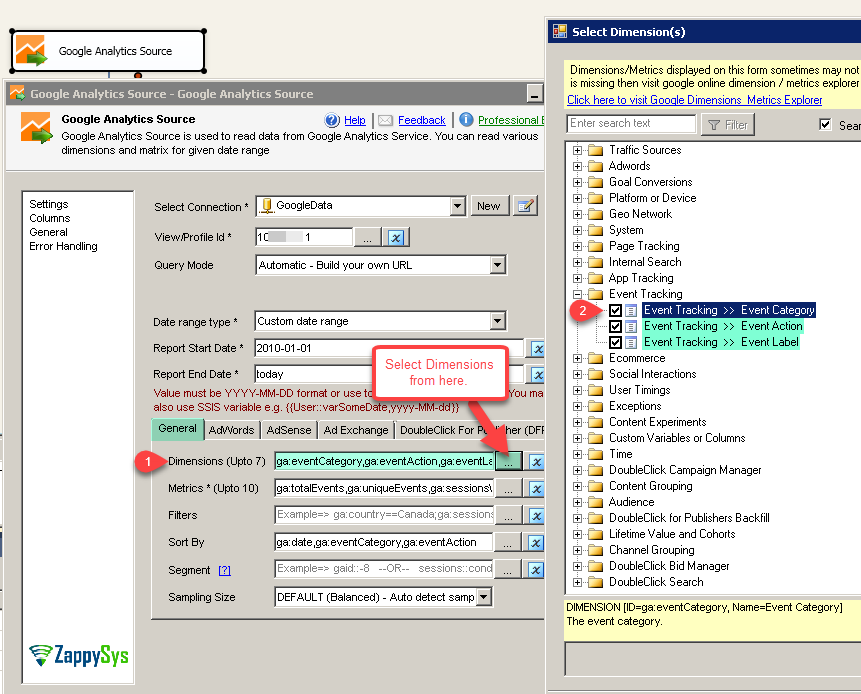
The dimensions parameter breaks down metrics by common criteria; for example, by ga:browser or ga:city. While you can ask for the total number of pageviews to your site, it might be more interesting to ask for the number of pageviews broken down by browser. In this case, you'll see the number of pageviews from Firefox, Internet Explorer, Chrome, and so forth.
When using dimensions in a data request, be aware of the following constraints:
•You can supply a maximum of 7 dimensions in any query.
•You can not send a query composed only of dimensions: you must combine any requested dimensions with at least one metric.
•Only certain dimensions can be queried in the same query. Use the valid combination tool in the Dimensions and Metrics Reference to see which dimensions can be used together.
|
| Metrics |
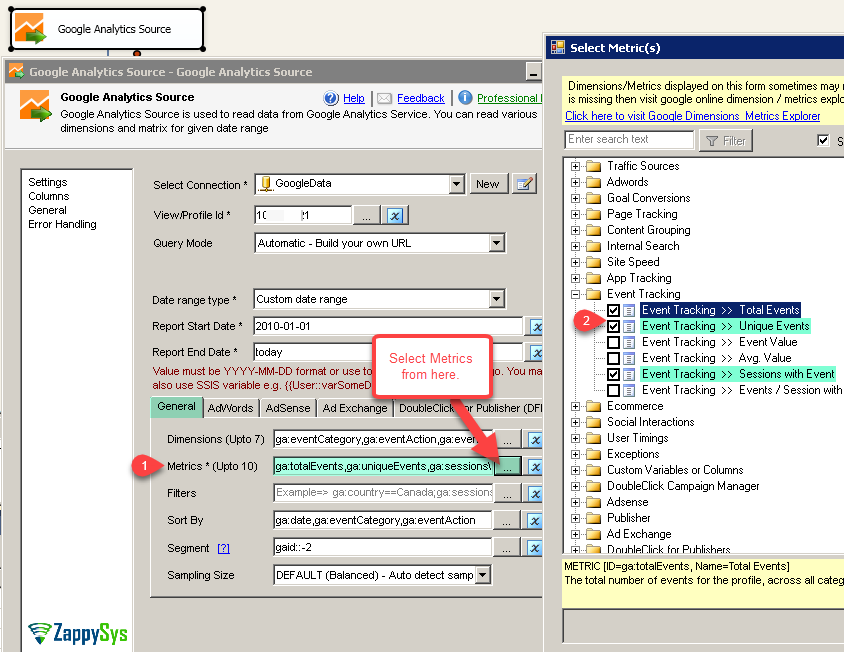
The aggregated statistics for user activity to your site, such as clicks or pageviews. If a query has no dimensions parameter, the returned metrics provide aggregate values for the requested date range, such as overall pageviews or total bounces. However, when dimensions are requested, values are segmented by dimension value. For example, ga:pageviews requested with ga:country returns the total pageviews per country. When requesting metrics, keep in mind:
•Any request must supply at least one metric; a request cannot consist only of dimensions.
•You can supply a maximum of 10 metrics for any query.
•Most combinations of metrics from multiple categories can be used together, provided no dimensions are specified.
•A metric can be used in combination with other dimensions or metrics, but only where valid combinations apply for that metric. See the Dimensions and Metrics Reference for details.
|
| SortBy |
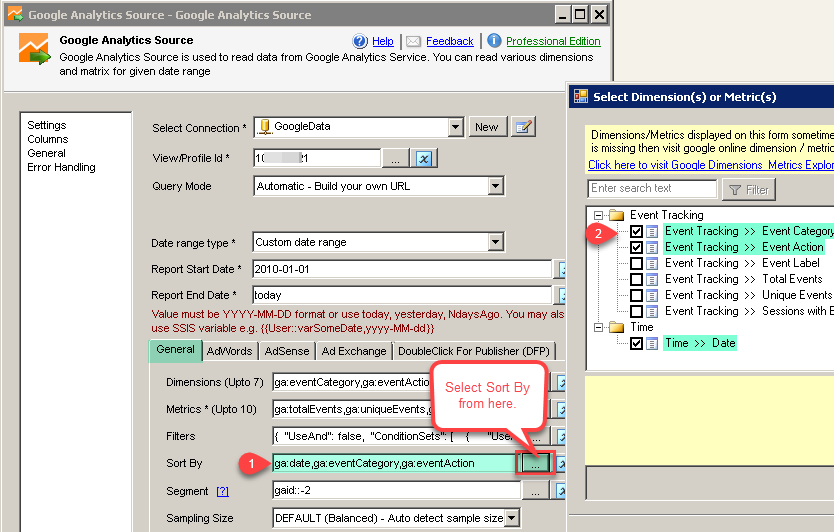
A list of metrics and dimensions indicating the sorting order and sorting direction for the returned data.
•Sorting order is specified by the left to right order of the metrics and dimensions listed.
•Sorting direction defaults to ascending and can be changed to descending by using a minus sign (-) prefix on the requested field.
Sorting the results of a query enables you to ask different questions about your data. For example, to address the question 'What are my top countries, and which browsers do they use most?' you can make a query with the following parameter. It sorts first by ga:country and then by ga:browser, both in ascending order:
sort=ga:country,ga:browser
To answer the related question 'What are my top browsers, and which countries use them most?', you can make a query with the following parameter. It sorts first by ga:browser and then by ga:country, both in ascending order: sort=ga:browser,ga:country
When using the sort parameter, keep in mind the following:
•Sort only by dimensions or metrics values that you have used in the dimensions or metrics parameters. If your request sorts on a field that is not indicated in either the dimensions or metrics parameter, you will receive a error.
•By default, strings are sorted in ascending alphabetical order
in en-US locale.
•Numbers are sorted in ascending numeric order by default.
•Dates are sorted in ascending order by date by default.
|
| Filters |
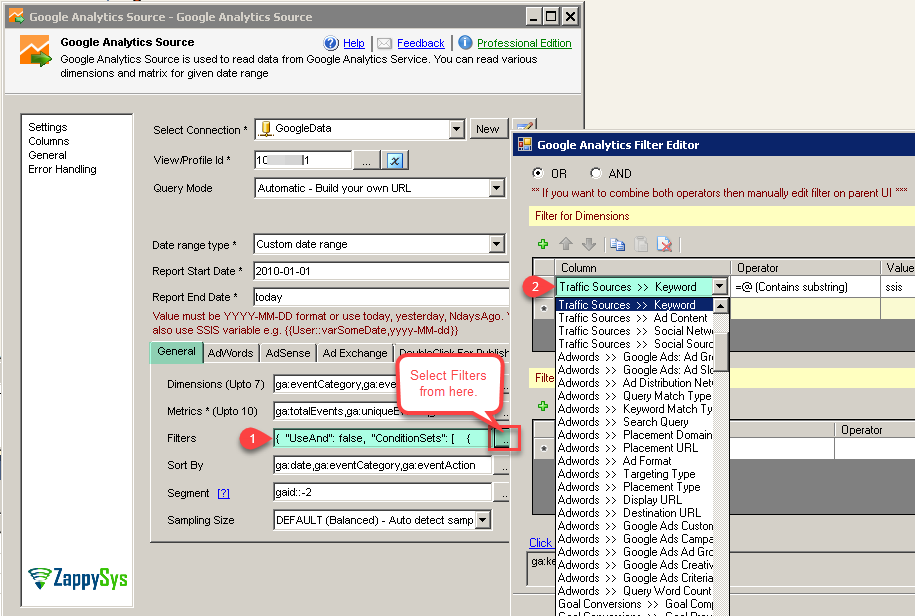
The filters query string parameter restricts the data returned from your request. To use the filters parameter, supply a dimension or metric on which to filter, followed by the filter expression. |
| Segment |
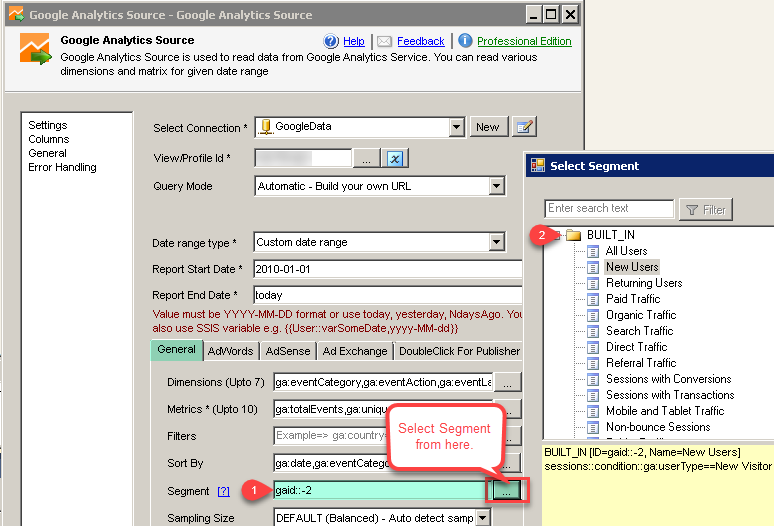
Segment for query. Segment can be defined using inbuilt segment id or use custom segment expression. For example to use in-built segment for referral; data you can use expression with just ID (e.g. gaid::-8) OR use full expression (e.g. sessions::condition::ga:medium==referral). Use report (MetaData: Segments) under QueryMode=FromTemplate to get full detail about all in-built or custom segments. For more information on segments visit https://developers.google.com/analytics/devguides/reporting/core/v3/segments |
| MaxResults |
Maximum number of rows to include in each response (i.e. Batch Size). You can use this in combination with start-index to retrieve a subset of elements, or use it alone to restrict the number of returned elements, starting with the first. If max-results is not supplied, the query returns the default maximum of 1000 rows.The Analytics Core Reporting API returns a maximum of 10,000 rows per request, no matter how many you ask for. It can also return fewer rows than requested, if there aren't as many dimension segments as you expect. For instance, there are fewer than 300 possible values for ga:country, so when segmenting only by country, you can't get more than 300 rows, even if you set max-results to a higher value. |
| SamplingLevel |
Use this parameter to set the sampling level (i.e. the number of sessions used to calculate the result) for a reporting query. The allowed values are consistent with the web interface and include:
•DEFAULT — Returns response with a sample size that balances speed and accuracy.
•FASTER — Returns a fast response with a smaller sample size.
•HIGHER_PRECISION — Returns a more accurate response using a large sample size, but this may result in the response being slower.
If not supplied, the DEFAULT sampling level will be used.See the Sampling section for details on how to calculate the percentage of sessions that were used for a query.
Available Options (Use numeric value listed in bracket if you have to define expression on this property (for dynamic behavior).
| Option |
Description |
| DEFAULT [0] |
DEFAULT (Balanced) - Auto detect sample size |
| FASTER [1] |
FASTER (Fast) - Use smaller sample size |
| HIGHER_PRECISION [2] |
HIGHER_PRECISION (Slow) - Using a large sample size |
|
| MaxRows |
Maximum number of rows to return (To adjust batchsize check MaxResults property). 0=Unlimited |


